HKTDC Export Confidence Index 1Q25: Export Confidence Improves Despite Growing Trade Tensions(Part2)
Industry outlook
In terms of industry sector, the Current Performance of Jewellery rallied after a drop in the previous quarter, reaching 53.1 (up 5.4). Sentiment in Electronics picked up with its Current Performance (52.3, up 2.9) back above the watershed level. Timepieces registered an improvement in Current Performance (51.2, up 2.1), above 50 for first time in 12 months. Equipment/Materials (50.3, down 3.3) and Clothing (49.7, down 0.4) hovered around the 50 level, while Toys (44.6) edged down by 1.4 points.
When it comes to Expectation, sentiment improved across most industries. Five out of six sectors saw their outlook as likely to improve, including Electronics (up 1.3), Clothing (up 2.5), Toys (up 0.6), Jewellery (up 1.0) and Equipment/Materials (up 2.2).
Jewellery maintained a relatively strong outlook, with a sturdy Expectation reading moving further into positive space (54.4). Equipment/Materials (52.6) and Timepieces (51.1, down 4.2) stayed marginally above the average. Toys (50.7) and Electronics (50.6) remained in neutral territory. Clothing (49.4), despite an increase of 2.5, stayed in the contractionary zone.
Current Performance | Expectation | |||||||
1Q25 | 4Q24 | 3Q24 | 2Q24 | 1Q25 | 4Q24 | 3Q24 | 2Q24 | |
Overall | 52.1 | 50.3 | 52.6 | 51.6 | 51.0 | 50.0 | 51.4 | 54.3 |
Electronics | 52.3 | 49.4 | 52.9 | 52.4 | 50.6 | 49.3 | 51.4 | 55.0 |
Clothing | 49.7 | 50.1 | 58.9 | 48.7 | 49.4 | 46.9 | 61.2 | 48.1 |
Toys | 44.6 | 46.0 | 54.1 | 47.8 | 50.7 | 50.1 | 58.7 | 51.8 |
Jewellery | 53.1 | 47.7 | 52.2 | 52.0 | 54.4 | 53.4 | 56.4 | 53.0 |
Timepieces | 51.2 | 49.1 | 42.7 | 41.3 | 51.1 | 55.3 | 46.3 | 45.3 |
Equipment/Materials | 50.3 | 53.6 | 53.0 | 51.0 | 52.6 | 50.4 | 53.2 | 52.5 |
Source: HKTDC Export Confidence Index Surveys (2Q24 - 1Q25) | ||||||||
Taking a closer look into key assessment factors, exporters across all sectors reported optimistic Sales and New Orders for the next quarter, particularly in the case of Jewellery (59.9) and Equipment/Materials (55.4). Exporters stayed optimistic about raising prices to counter lingering cost pressures, with the Trade Value Expectation Sub-Index staying well above 50 in almost all sectors.
Electronics | Clothing | Toys | Jewellery | Timepieces | Equipment/ Materials | |||||||
Current | Expect | Current | Expect | Current | Expect | Current | Expect | Current | Expect | Current | Expect | |
HKTDC Export Index | 52.3 | 50.6 | 49.7 | 49.4 | 44.6 | 50.7 | 53.1 | 54.4 | 51.2 | 51.1 | 50.3 | 52.6 |
Sales and New Orders | 56.4 | 53.2 | 51.4 | 51.4 | 47.9 | 54.7 | 57.9 | 59.9 | 52.5 | 51.9 | 54.5 | 55.4 |
Trade Value | 54.7 | 52.8 | 63.7 | 60.5 | 48.0 | 56.9 | 56.5 | 57.3 | 69.6 | 60.7 | 51.9 | 63.6 |
Overall Cost # | 27.9 | 34.2 | 26.6 | 24.2 | 13.7 | 20.6 | 36.3 | 37.1 | 33.0 | 34.8 | 37.7 | 42.0 |
Procurement | 58.4 | 53.8 | 62.1 | 57.3 | 52.0 | 57.8 | 51.6 | 46.8 | 56.3 | 58.9 | 55.6 | 52.5 |
Inventory # | 51.7 | 51.4 | 39.7 | 47.4 | 51.1 | 51.2 | 49.1 | 54.4 | 41.1 | 46.4 | 39.4 | 41.3 |
Note: # The Cost and Inventory sub-indices are inverted. Cost sub-index: A reading above 50 indicates a downward trend on costs, while a reading below 50 indicates an upward trend on costs. Inventory sub-index: A reading above 50 indicates a lower-than-normal inventory level, while a reading below 50 indicates a higher-than-normal inventory level. | ||||||||||||
Thematic Responses
In response to the new round of higher US tariffs, Hong Kong exporters considered diversifying sourcing (46.8%) to be the most optimum strategy, followed by new market expansion (39.7%). Meanwhile, close to 30% of respondents had considered relocating their production bases, slightly ahead of the percentage looking to reduce reliance on the US market (27.9%).
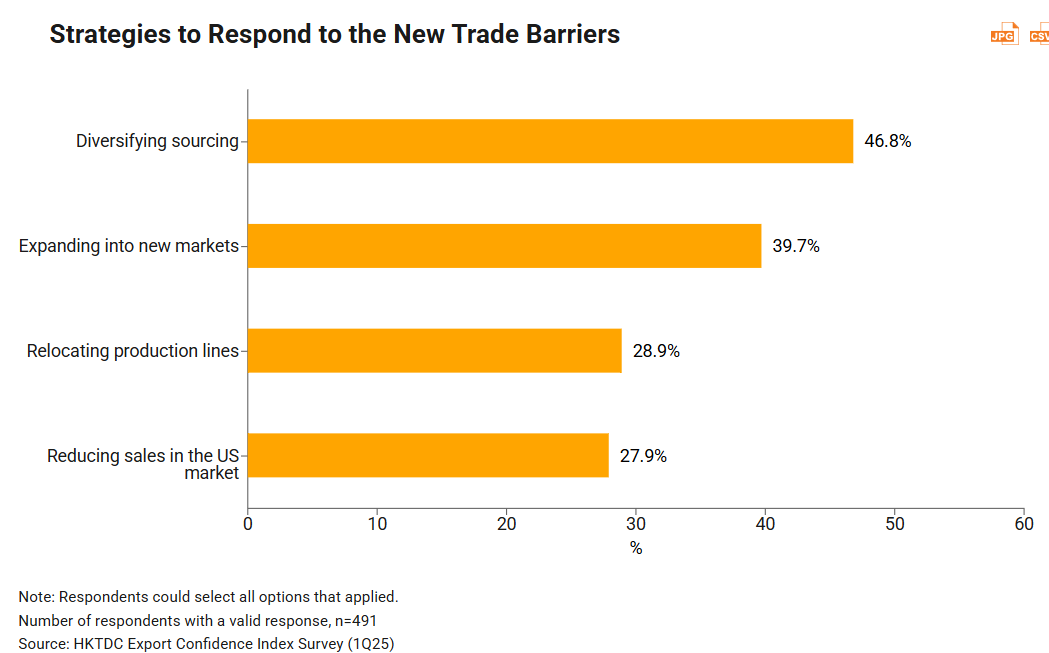
Looking at individual industries' top three strategies, all sectors favoured sourcing diversification, five out of six sectors were looking to expand into new markets, and four out of six sectors had opted to reduce sales to the US.
Strategies in Response to New Rounds of Higher US Tariffs
Diversifying sourcing | Expanding to new markets | Relocate production lines | Reducing sales | |
Electronics | 53.1% | 44.8% | 31.4% | 26.3% |
Clothing | 54.4% | 42.1% | 21.1% | 42.1% |
Toys | 61.2% | 16.3% | 42.9% | 36.7% |
Jewellery | 32.3% | 39.0% | 18.6% | 22.0% |
Timepieces | 28.8% | 48.1% | 21.2% | 28.8% |
Equipment/Materials | 40.0% | 35.0% | 32.5% | 20.0% |
Note: Respondents could select all options that applied. | ||||
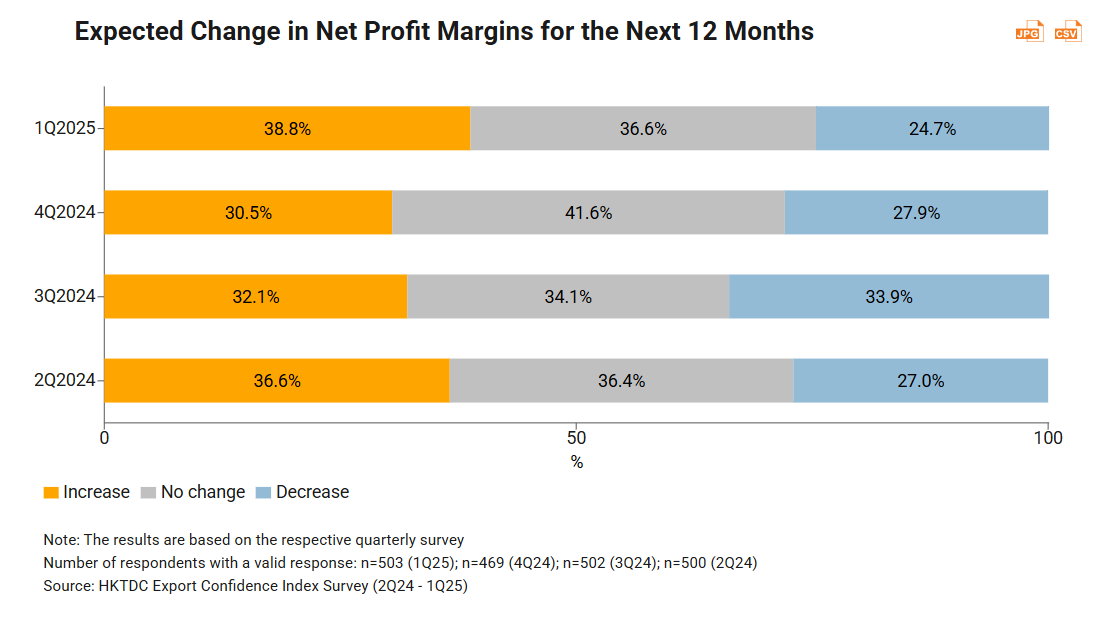
In terms of profitability outlook, the majority of respondents (75.4%) anticipated that their net profit margins would increase or, at the very least, remain the same. This was notably above the figure for 4Q24 (72.1%), as well as being the highest for 12 months. Partly on account of the potential for higher unit prices to mitigate cost pressures, about 39% of exporters indicated they remained optimistic about their net profit margins, with 37% confident they could maintain their current profit level.
Appendix
The HKTDC Export Confidence Index was introduced in 1Q24. It is a composite of five sub indices – Sales and New Orders, Trade Value, Cost, Procurement and Inventory – and seeks to provide a comprehensive overview of Hong Kong exporter sentiment.
There are two primary / overall indices, one of which gauges the Current Performance in the present quarter, while the other considers the Expectation for the upcoming quarter via a weighted average of the following five sub indices:
Sales and New Orders: This is an indication of overall export performance as well as the level of new export orders received by respondents. This index is compiled based on respondents' feedback regarding the prospects of each of their major export markets.
Trade Value: This focuses on tracking the movement of unit export prices.
Cost: This tracks cost pressures as they relate to day-to-day operations, including raw material prices / labour and other operational costs/ financing requirements. Compared with the other indices, it is an inverted index, with an index reading above 50 indicating a downward trend for costs, while a reading below 50 indicates an upward trend for costs.
Procurement: This is a measure of the input-buying activity of Hong Kong traders.
Inventory: This tracks the overall inventory levels held by respondents for present use and the upcoming quarter. An index reading above 50 indicates a lower-than-normal inventory level, while a reading below 50 indicates a higher-than-normal inventory level.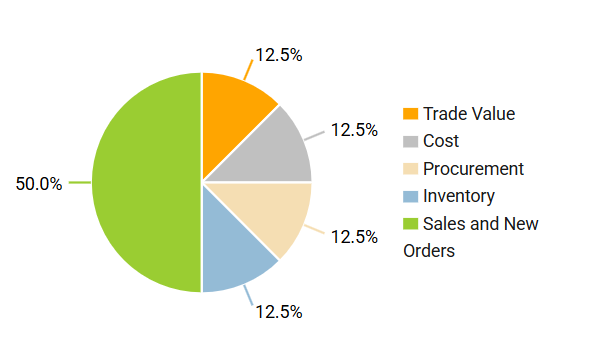
________________________________________________________________________________________________
1 1Q25 data were collected during 3 – 28 February 2025.
2 The Sales and New Orders Sub-Index is compiled from respondents' feedback regarding the prospects for their major export markets.






















First, please LoginComment After ~